Model Structure and Parameters Estimates in Brief
PDF of Methodology (with Appendix)
Underlying Model
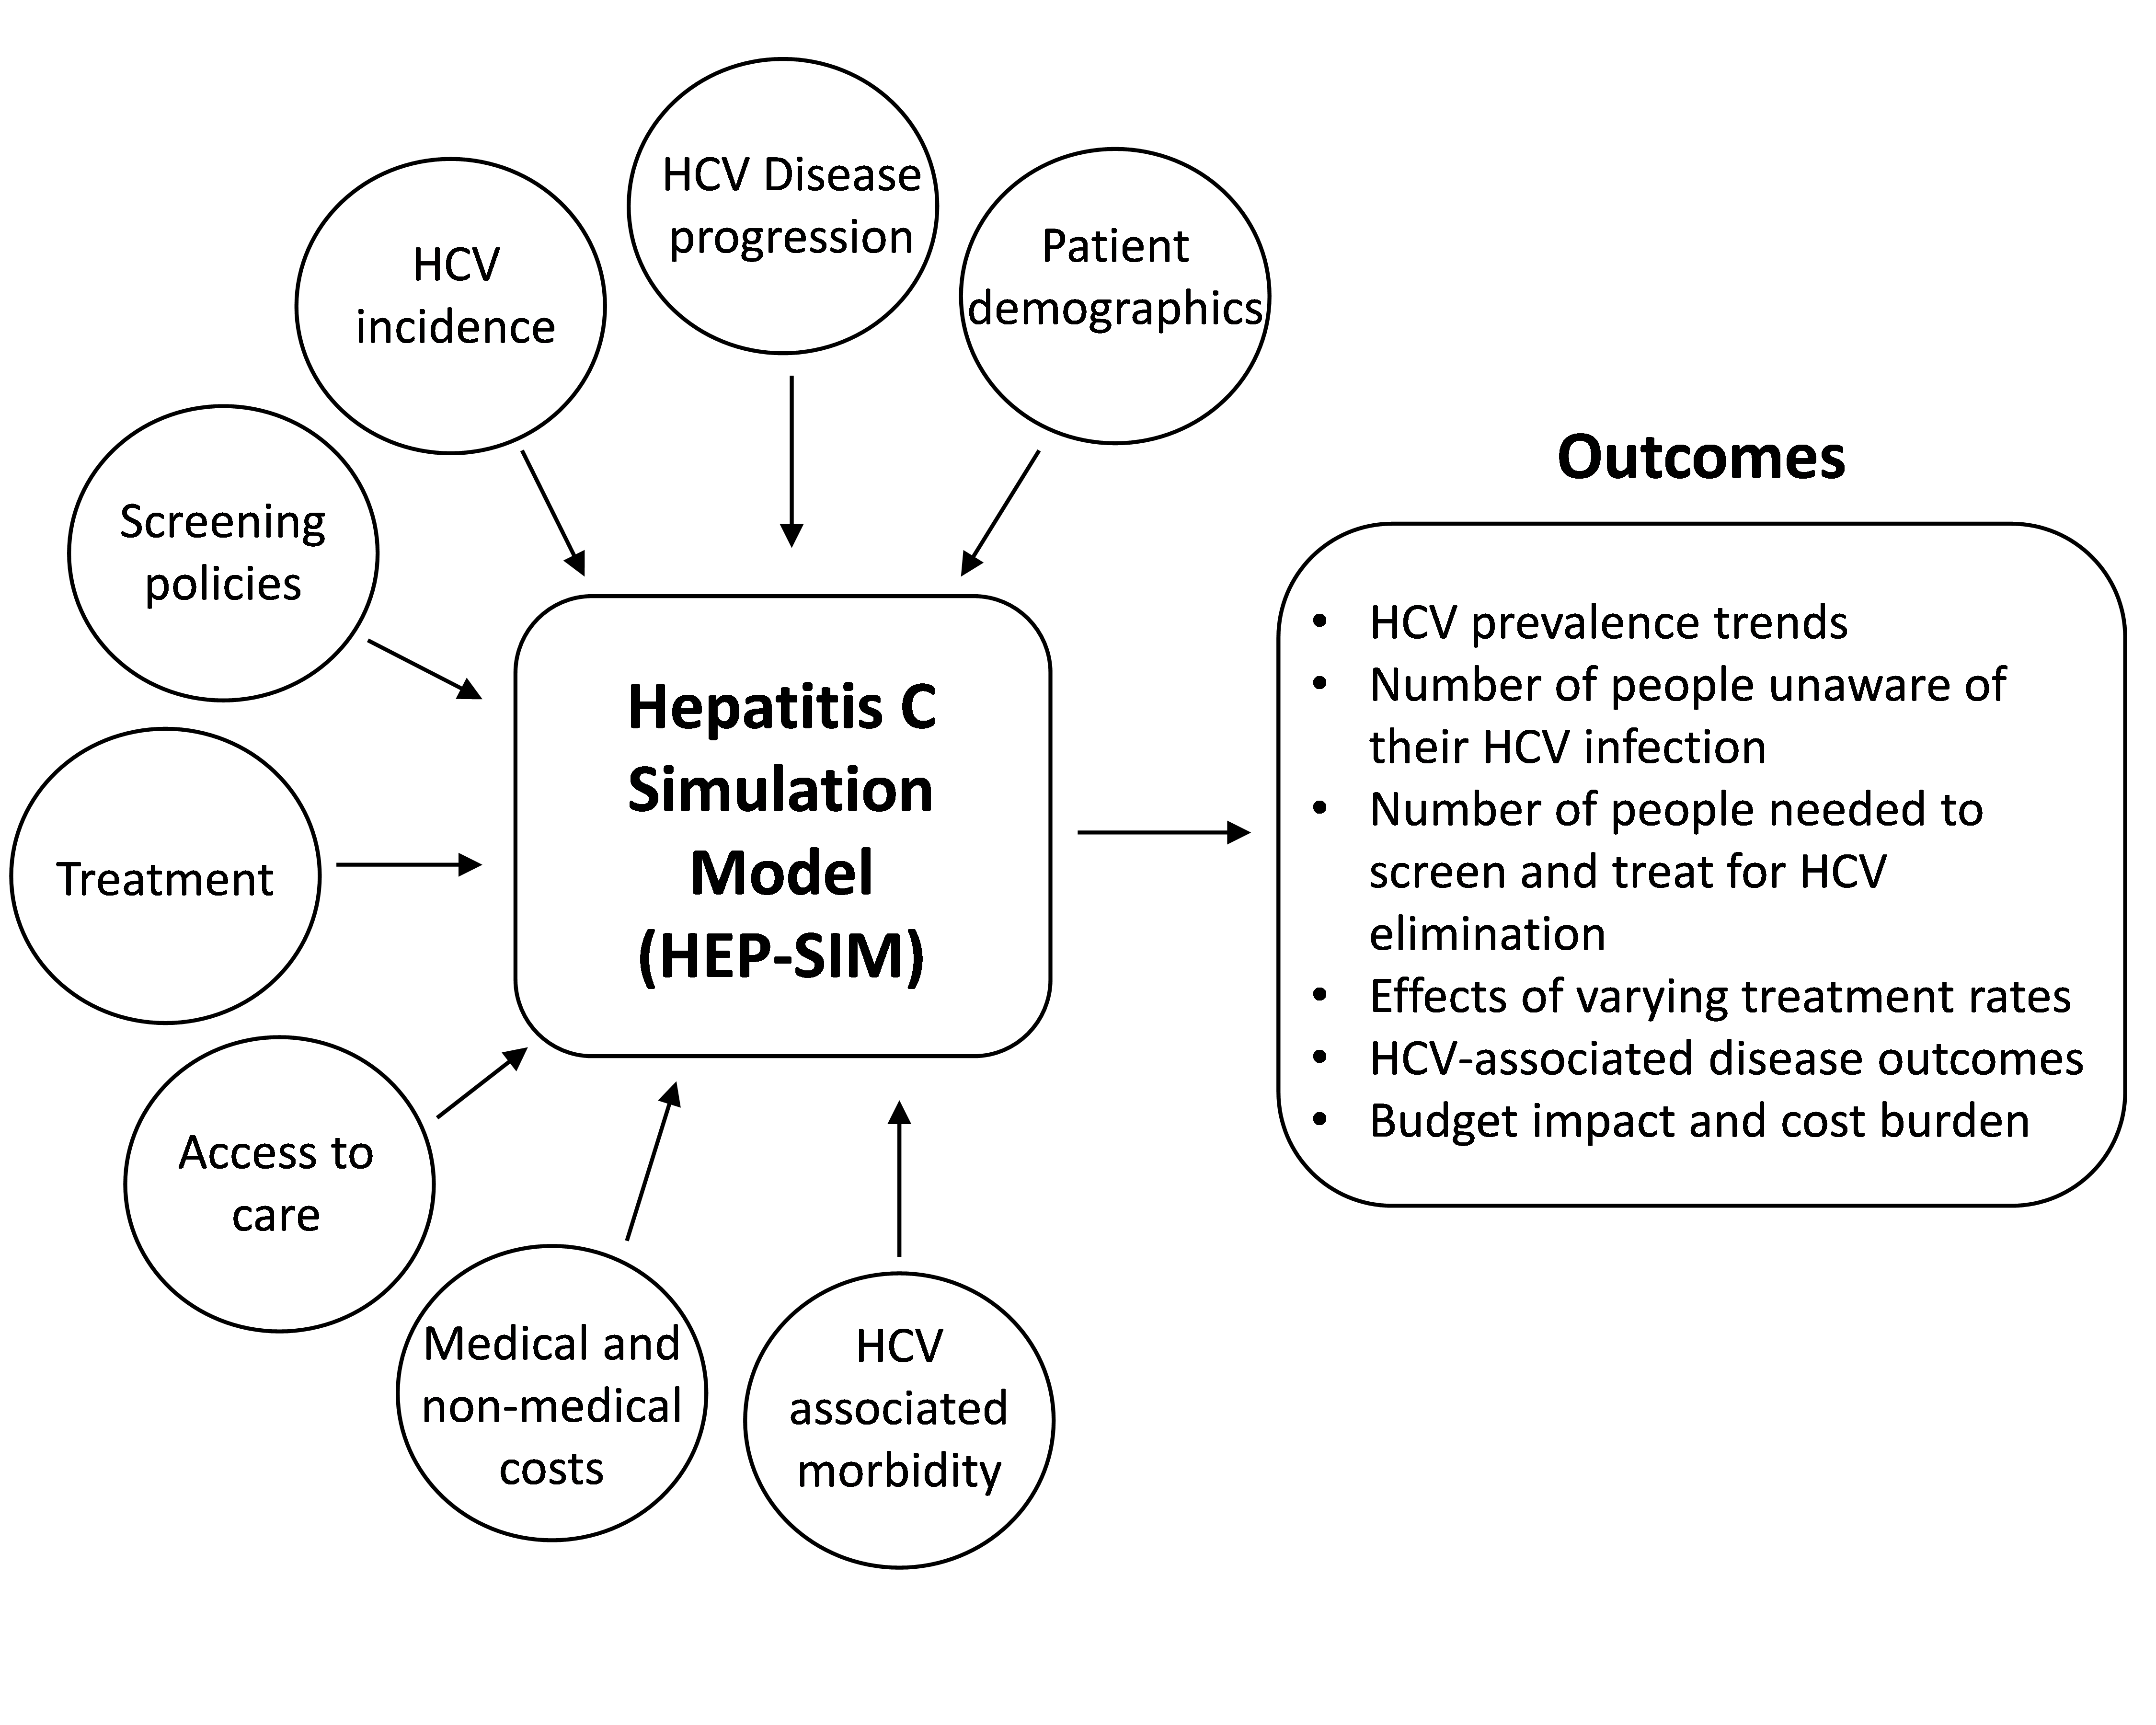
The Hep C State Policy Simulator (hereafter, the Simulator) uses a previously validated mathematical model, HEP-SIM, which includes information on patient demographics, hepatitis C disease progression, hepatitis C screening, therapeutic advancement, access to healthcare (including insurance status), and the cost of care and treatment to assess temporal trends in hepatitis C disease burden and cost burden from 2018 to 2030 (Figure 1, adapted from Chhatwal et al.1).1-3 The HEP-SIM model has been used to project the changing prevalence and various outcomes of hepatitis C virus (HCV) infection in the United States since 2001, and has been validated with multiple studies and national surveys.4-7
Figure 1: Key components and outcomes of HEP-SIM:
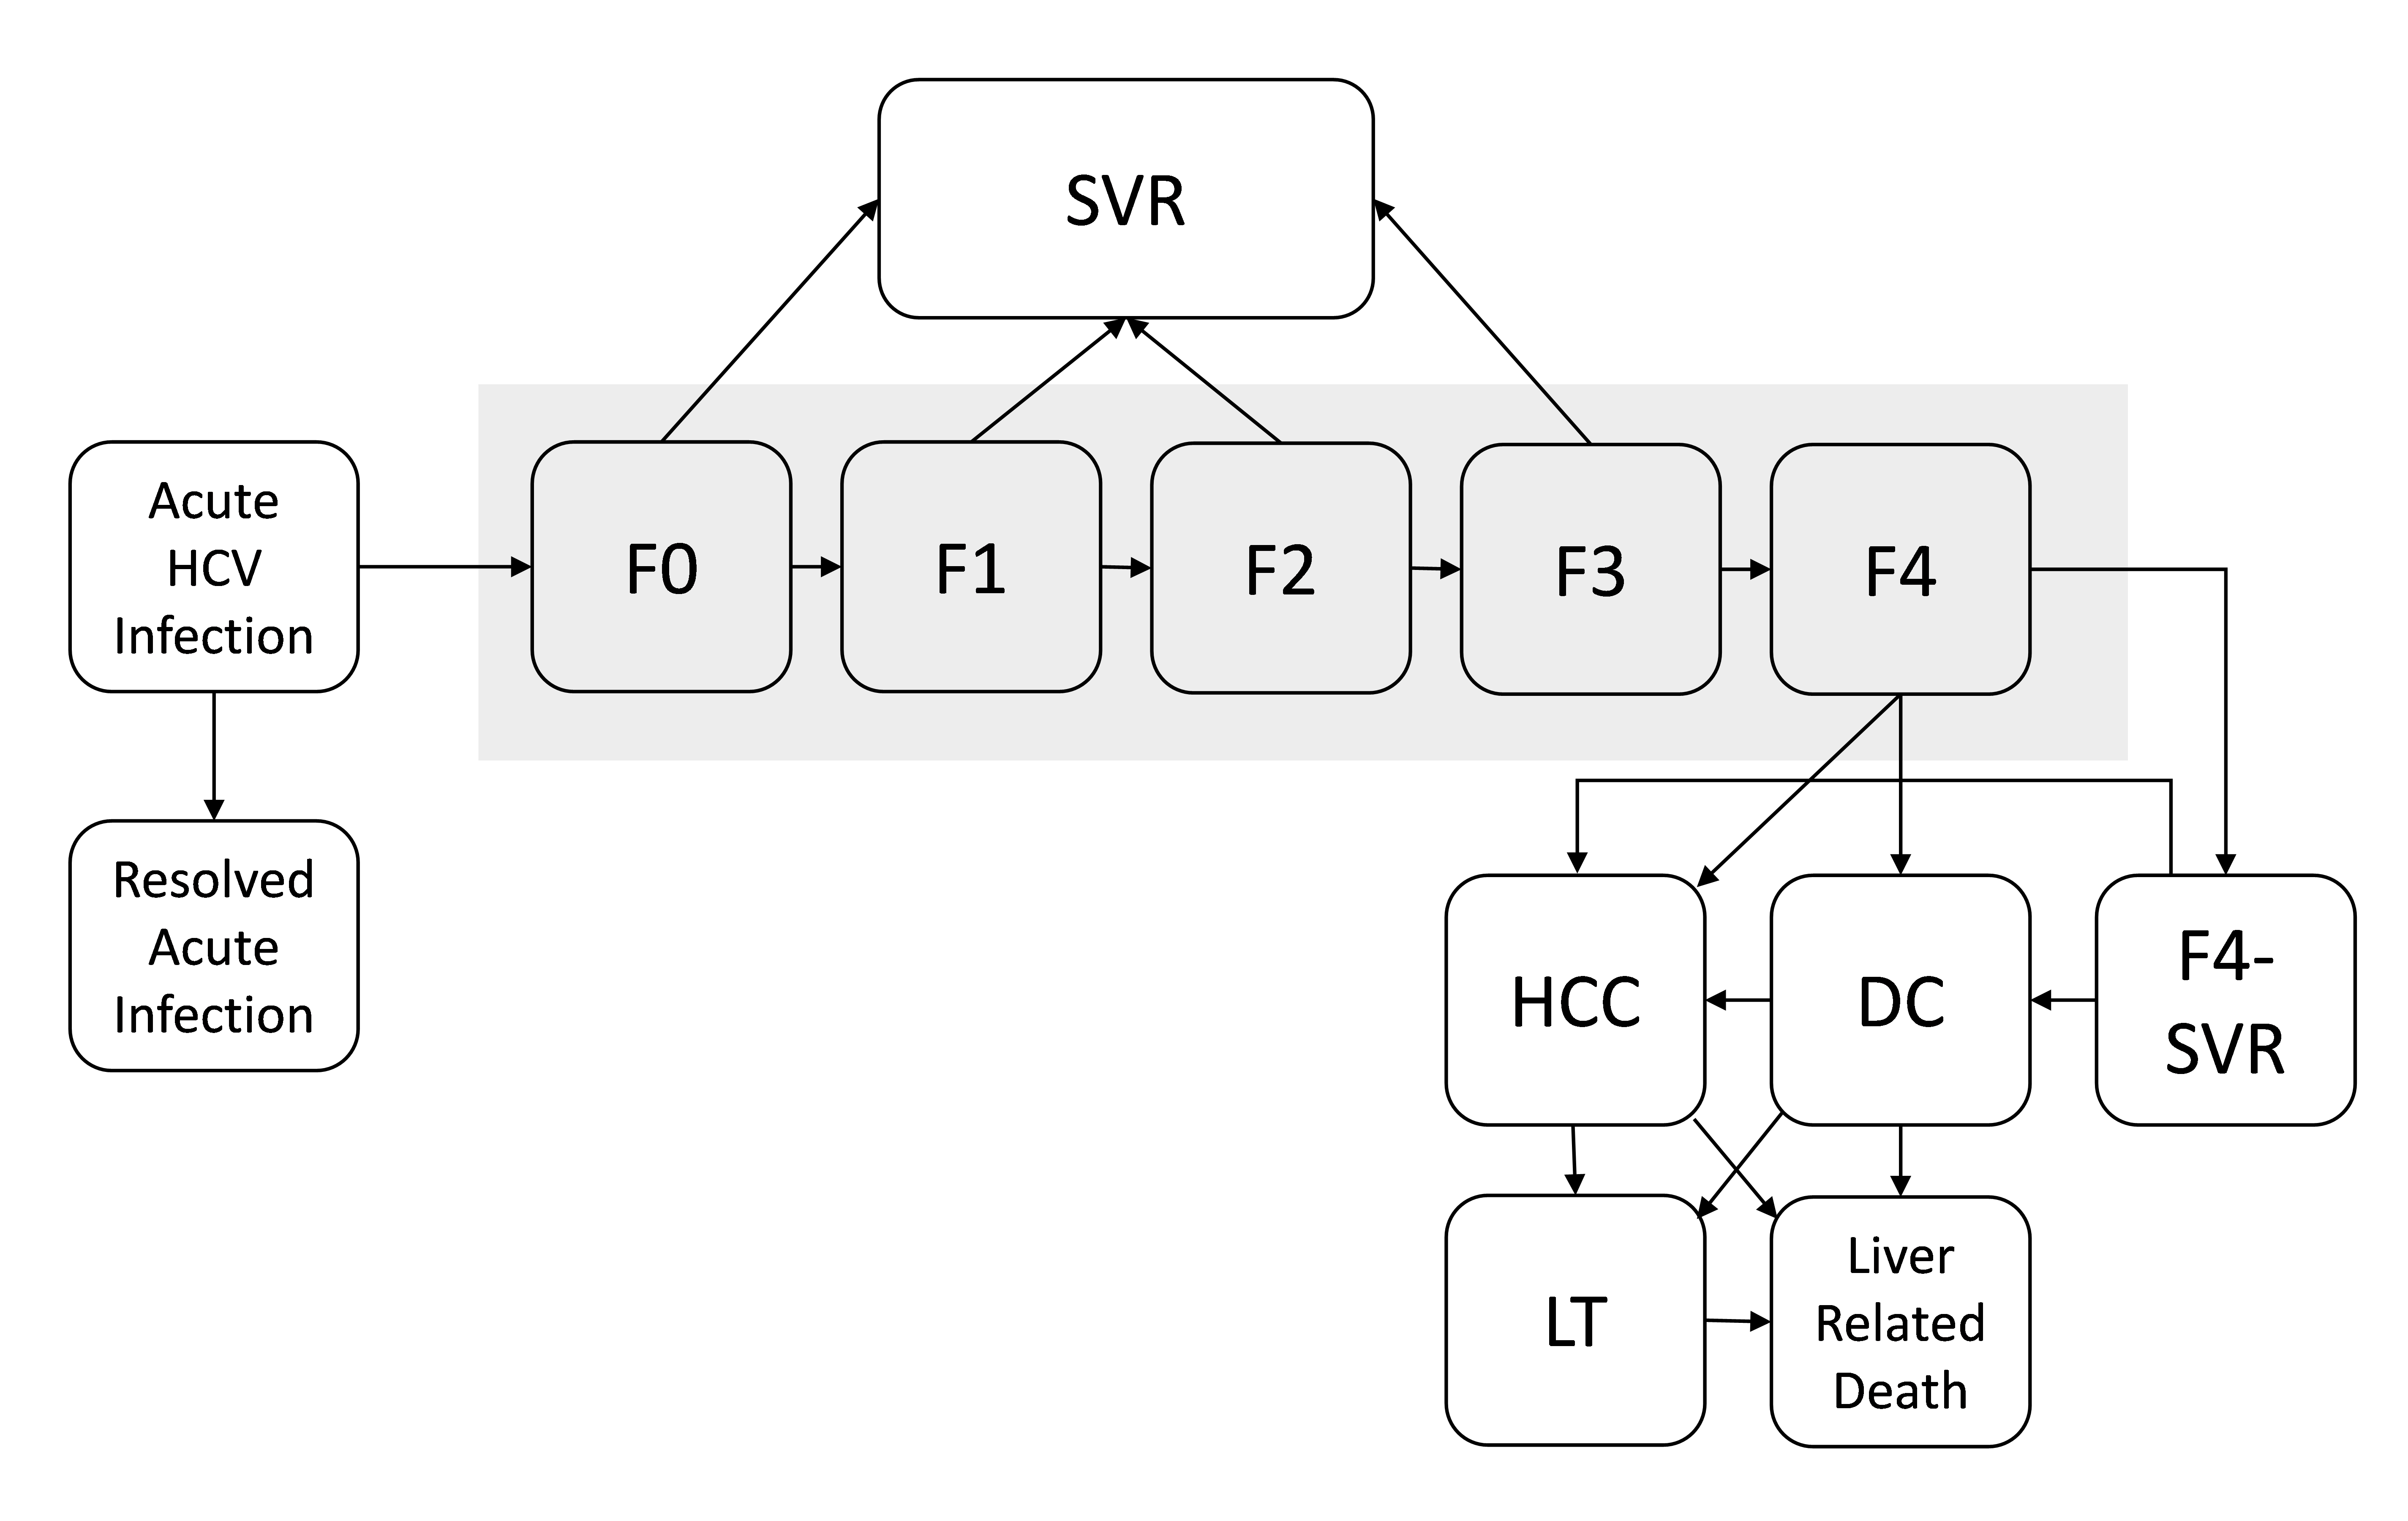
The natural history of hepatitis C development is simulated as a state-transition model (Figure 2, adapted from Chhatwal et al.1). At any given time, a patient will be in one of the health states represented by the boxes. The health states include infection stages (acute HCV infection and resolved HCV infection) as well as chronic disease stages (F0, no liver fibrosis; F1, portal fibrosis without septa; F2, portal fibrosis with few septa; F3, many septa without cirrhosis; and F4, cirrhosis). Patients can transition to different health states, as illustrated by arrows. Patients whose disease is successfully treated transition to the sustained virologic response (SVR) state from states F0 to F3 and are assumed to be cured. In contrast, patients in F4 state who are successfully treated (illustrated as F4-SVR state) may develop further complications. In addition, patients in hepatocellular carcinoma (HCC), decompensated cirrhosis (DC), and liver transplantation (LT) states have higher mortality rates than do people in the general population. All other patients have the same mortality rates as that of the general population.
We also account for new HCV infections. However, our model explicitly excludes re-infection. Available data, while limited, suggest reinfection rates are generally low.8,9 Moreover, incident cases, which are captured in the model, indirectly account for re-infections to some extent.
Figure 2: State-transition model of the natural history of HCV:
Estimating Model Parameters
We used a variety of data sources to estimate model parameters. Below we describe different components of model inputs and their data sources.
HCV Epidemiology
- State-level HCV prevalence
- This parameter captures the number of adults living with HCV infection in each US state and the District of Columbia. The input values are based on recently published work10 that leverages multiple data sources and advanced statistical models to estimate the prevalence of current HCV infection in each state from 2013 to 2016 (Appendix Table A.1). While users can change the default value, the model limits user adjustments to between -50% and +200% of the default value. This range balances user flexibility within a reasonable uncertainty range for default values and application speed online.
- State-level estimates of HCV prevalence by incarceration and insurance coverage
- Incarcerated population: Estimates for HCV prevalence in state prisons are taken from the Hep Corrections,11 which brings together data from both peer-reviewed publications and other sources. Most notably, the site uses data contributed by Siraphob Thanthong-Knight, whose findings about access to hepatitis C treatment in prisons are featured in a 2018 Kaiser Health News special article,12 and a previously conducted survey.13
- Non-incarcerated population: For each state, this parameter captures the breakdown of patients with HCV by insurance status: Medicaid, Medicare, privately insured, and uninsured. Input values are based on a recent CDC analysisof 2012-2015 state-level data on ambulatory, inpatient, and urgent care visits available through the National Center for Health Statistics (NCHS) and the Healthcare Cost and Utilization Project (HCUP) (Appendix Table A.2). CDC combined these data with evidence on frequency of seeking medical care among patients with HCV15 and those with opioid abuse/dependence16 to estimate the number of patients with HCV in each insurance category. Where state-level estimates are not available, the corresponding estimates from the census division/region level are used (Appendix Table A.2).
- Combined estimates: For each state, the estimates of HCV prevalence10 are combined with the estimated breakdown of patients with HCV by insurance status and incarceration to compute the number of HCV-infected individuals within each subpopulation: Medicaid, Medicare, privately insured, uninsured, and incarcerated (Appendix Table A.1). If users choose to change the default value for HCV prevalence, then the estimated breakdown by subpopulation is applied to the updated prevalence value.
- HCV genotype
- The HCV genotype distribution is assumed to be the same for all states and is obtained from Mapping Hep C.16
- HCV fibrosis stage distribution
- The HCV fibrosis stage distribution is assumed to be the same for all states and is obtained from Mapping Hep C.16
- HCV incidence
- Estimates of the new (incident) cases of HCV infection by year are obtained from CDC reports for the years 2010–2016. Data from 2007 to 2016 are downloaded from the CDC website.17 Where state-level estimates are not available, an estimate applying the national rate to the state population is used (Appendix Table A.3). For the years between 2017 and 2028, we projected trends in HCV incidence by assuming that annual incidence continues to trend upward at the rate observed between 2006 and 2016. From 2029 onwards, we assumed that incidence rates stabilize and remain flat (Appendix Table A.4).
- HCV Awareness
- The probability that an HCV-infected person was aware of his/her infection at the start of the model simulation depended on their age and insurance status. We relied on information from published studies of NHANES data for this information (Appendix Table A.5).5,18
Interventions
For each state, the user can define a hepatitis C screening strategy, an annual treatment rate, treatment restrictions (if any), and cost of hepatitis C treatment with direct-acting antivirals (DAAs).
- Screening strategy
- Provider-driven diagnostic and risk-based testing: This strategy is equivalent to diagnostic and risk-based testing for high-risk individuals, as defined in the CDC’s 1998 Recommendations, before birth cohort screening was recommended. The estimated annual testing rate for all persons was set to approximately 3%.19 Within that overall or average rate, individual probabilities for testing varied by disease stage (so, for example, we assume providers were more likely to initiate testing for individuals with symptoms of advanced liver disease)
- Birth cohort screening: This strategy is equivalent to risk-based testing (as outlined above, under the first screening strategy option) plus one-time screening for all individuals born between 1945 and 1965 (i.e., Baby Boomers), as defined in the 2013 U.S. Preventive Services Task Force’s Hepatitis C Screening Recommendation. Under this strategy, the estimated annual screening rate for Baby Boomers was set to 9%;19 fort those born before 1945 or after 1965, the annual screening rate remained 3%. We further assume that the annual screening rate will remain elevated among Baby Boomers until 90% of individuals chronically infected with HCV have been diagnosed. Past this threshold, the diagnostic benefit would decrease.
- Universal screening: This strategy assumes one-time screening, recommended for all adults 18 years of age and older, with repeat testing for those at high risk for infection.20 The default annual screening rate for universal, one time screening of adults is 9%. This default rate reflects an assumption on our part that annual one-time screening rate for all adults will not be materially different from that achieved for Baby Boomers under current birth cohort recommendations. However, given the lack of available real-world data, users are also given the option to enter the rate of their choice. As is true of the birth-cohort screening strategy, we assumed that the annual rate will persist until 90% of all individuals 18 years of age and older who are chronically infected with HCV have been diagnosed. Past this threshold, the diagnostic benefit would decrease.
- Annual treatment rate
- This captures the annual percentage of all diagnosed individuals within given subpopulation(s) who are expected to receive treatment. It thus attempts to quantify, in a single number, the combined effects of patient treatment seeking behaviors and health system capacity to provide treatment in a given year. Factors to consider when setting this rate for a subpopulation include, but are not limited to, patient awareness of treatment, provider restrictions (e.g., requirements that treatment be managed by a specialist), and availability and accessibility of trained providers. Based on limited data and expert opinion, the Simulator provides default values for each subpopulation. However, users are also given the option to enter the rate of their choice.
- Treatment restrictions
- The Simulator layers treatment restrictions on top of the selected treatment rate. In other words, the annual treatment rate parameter represents system capacity to treat all diagnosed individuals in the absence of any treatment restrictions. The actual treatment rate (a percentage of all diagnosed individuals who are treated in a given year) will be lower if a user subsequently adds a treatment policy restriction (e.g., F2 and above). For example, a state with 50% treatment capacity and policies restricting treatment to individuals with advanced liver disease (F3 or above) within Medicaid might ultimately only treat 20% of all Medicaid beneficiaries diagnosed with hepatitis C in a given year. The treatment restriction options available for application include the following:
- F3 and F4 only: Only individuals with advanced liver disease (stage 3 fibrosis or worse) are eligible for treatment
- F2 and above: Only individuals with moderate to severe liver disease (stage 2 fibrosis or worse) are eligible for treatment
- No restrictions: All individuals, regardless of the current extent of damage to their livers (includes individuals with stages 0 and 1 disease) are eligible for treatment
- The Simulator layers treatment restrictions on top of the selected treatment rate. In other words, the annual treatment rate parameter represents system capacity to treat all diagnosed individuals in the absence of any treatment restrictions. The actual treatment rate (a percentage of all diagnosed individuals who are treated in a given year) will be lower if a user subsequently adds a treatment policy restriction (e.g., F2 and above). For example, a state with 50% treatment capacity and policies restricting treatment to individuals with advanced liver disease (F3 or above) within Medicaid might ultimately only treat 20% of all Medicaid beneficiaries diagnosed with hepatitis C in a given year. The treatment restriction options available for application include the following:
- Treatment efficacy
- In accordance with current standards of care,22 treatment is assumed to consist of all-oral DAA combinations for both treatment naïve and treatment experienced patients (including those for whom initial DAA therapies did not work). Based on data from multiple clinical trials, as well as published outcomes reported by the TRIO and TARGET studies, the Simulator varies rates of sustained virologic response (SVR) by viral genotype, stage of fibrosis, treatment regimen, and treatment history (Appendix Table A.6).2
Cost Parameters
To evaluate the economic impact of interventions such as screening and treatment, we incorporate the cost of antiviral treatment with DAAs, cost of diagnosing infection, and cost of management of HCV-related diseases (e.g., cirrhosis, hepatocellular carcinoma, and liver transplant). All costs have been adjusted to 2018 dollar values.
- Cost of DAA treatment
- This captures the average total cost for a curative course of therapy. Treatment costs vary widely by payer and DAA medication. The default value set for all populations is $20,000, which is generally in line with some payers’ net purchase costs (post any negotiated rebates or discounts) for the newest pangenotypic regimens.22-25
- Cost of diagnosing infection
- o This captures the totality of resources involved in efforts to identify and diagnose one HCV-infected patient, including the costs of initial (e.g., antibody) and confirmatory (e.g., RNA) tests. Because the prevalence of infection varies, depending on the population targeted by a given screening strategy, the cost of diagnosing an HCV infection also varies by screening strategy. Based on previously published analyses, 21 the estimated cost per diagnosed infection is $2,500 for birth-cohort screening and $4,400 for universal screening. For provider-driven diagnostic and risk-based testing, we use a value of $357 per diagnosed infection. This estimate is calculated assuming at least one time testing of individuals at high risk for HCV infection (e.g., persons who inject drugs) having HCV (viremic) prevalence of 15.48%,21 the cost of antibody test of $35, and the cost of HCV RNA test of $98.
- Cost of management of HCV-related disease outcomes
- o The costs associated with managing diagnosed HCV infection vary, depending on the severity of liver disease present. Based on previously published assessments,27 we assume annual management costs associated with each health state range from a low of $809 (for those with fibrosis scores between F0 and F2) to $21,553 (for those with decompensated cirrhosis) and $114,505 (for those who receive a liver transplant, at least in the first year, when the transplant occurs). Importantly, disease management related costs only begin to accrue once an individual’s HCV infection has been diagnosed. Individuals who achieve SVR do not accrue any cost in the SVR state. However, if individuals progress to advanced liver disease (e.g., HCC) after achieving cure, they accrue the costs associated with the corresponding state.
Understanding Results
When users change default parameter values, these changes are applied at the start of 2019 and in all subsequent years. However, we include 2018 model outputs for all temporal trend graphs. Those 2018 results are generated based on the default parameter values for each state, so they offer users a baseline which they can evaluate the immediate effects of changes in assumed policy or disease burden.
Limitations
The Simulator is based on a mathematical model HEP-SIM, which projects future disease and economic burden associated with HCV.1-3 The HEP-SIM model is subject to a number of limitations. First, because HEP-SIM is a microsimulation model, model outcomes are affected by simulation noise. To reduce the noise, the Simulator runs the simulation for states with smaller HCV populations up to 25 times, depending on state HCV prevalence. Nonetheless, simulation noise could generate unexpected results in some cases. For instance, increasing treatment rates typically reduce HCV prevalence. In a few rare cases, a minor adjustment in treatment rates (e.g., from 20% to 21%) can cause a slight increase in the prevalence. However, with a more significant change in the treatment rate (e.g., from 20% to 25%), the expectant trend in hepatitis C prevalence will be recovered.
Second, we assumed that future HCV screening rates under ‘diagnostic and risk-based’ and ‘birth-cohort’ screening strategies are the same as the rates observed in year 2017. If future screening rates are lower than current rates, the Simulator may overestimate the benefits of screening and underestimate future disease burden. If future screening rates are higher than current rates, the Simulator may underestimate the benefits of screening. Third, we used state-reported cases of acute hepatitis C to estimate incident infections, although actual acute cases may significantly exceed reported cases in a given state or year. Fourth, our model did not include extrahepatic benefits resulting from HCV treatment, so the Simulator likely underestimates the cost-related benefits of HCV curative therapy. Finally, the Simulator does not allow users to conduct sensitivity analyses to assess the impact of input parameters’ uncertainty on outcomes
| Parameter | Default Value | User Adjustment to Values Allowed | Source |
|---|---|---|---|
|
HCV Epidemiology |
|||
| State-level HCV prevalence | See Appendix Table A.1 for default state values | Yes | 10 |
| State-level prevalence by subpopulation | |||
| Incarcerated population | See Appendix Table A.1 for state values | No | 11 |
| Non-incarcerated population (Medicare, Medicaid, Private, Uninsured) | See Appendix Table A.1 for state values | No | CDC analysis* |
| HCV genotype (national estimates) | G1: 75.7%, G2: 10.7%, G3: 11.9%, G4-6: 1.7% | No | 17 |
| HCV fibrosis stages (national estimates) | F0-F1: 44.2%, F2, 28.5%, F3:11.2%, F4:16.1% | No | 17 |
| HCV incidence | See Appendix Tables A.3 and A.4 for state values | No | 18 |
| HCV awareness rates | See Appendix Table A.5 for insurance status and age-specific values | No | 19 |
| Transition probabilities (annual) | |||
|
F0 to F1 |
0.117 | No | 28 |
| F1 to F2 | 0.085 | No | 28 |
| F2 to F3 | 0.120 | No | 28 |
| F3 to F4 | 0.116 | No | 28 |
| F4 to DC | 0.039 | No | 29 |
| F4 to HCC | 0.014 | No | 29 |
| F4-SVR to DC | 0.008 | No | 30 |
| F4-SVR to HCC | 0.005 | No | 30 |
| DC to HCC | 0.068 | No | 31 |
| DC to LT | 0.023 | No | 32,33 |
| DC (first year) to death from liver disease | 0.182 | No | 31 |
| DC (subsequent years) to death from liver disease | 0.112 | No | 31 |
| HCC to LT | 0.040 | No | 6,34 |
| HCC to death from liver disease | 0.427 | No | 29 |
| LT (first year) to death from liver disease | 0.116 | No | 35 |
| PLT to death from liver disease | 0.044 | No | 35 |
|
Interventions |
|||
| Screening Strategy | |||
| Provider-driven diagnostic and risk-based testing rate (annual) | 3% | No | 20,36 |
| Birth-cohort screening rate (annual) | 9% | No | 20,36 |
| Universal screening rate (annual) | 9% | Yes | 20,36 ** |
| Treatment rate (annual) | |||
| Medicaid | 50% | Yes | Unpublished data |
| Medicare | 50% | Yes | Unpublished data |
| Privately insured | 50% | Yes | 37 |
| Incarcerated | State-specific | Yes | 11 |
| Uninsured | 10% | Yes | Unpublished data |
| Treatment restrictions | |||
| Medicaid | State-specific | Yes | 38 |
| Medicare | No restrictions | Yes | 39 |
| Privately insured | No restrictions | Yes | Subject matter expertise |
| Incarcerated | F3 and above | Yes | 40 |
| Uninsured | F2 and above | Yes | Subject matter expertise |
| HCV treatment efficacy | See Appendix Table A.6 for SVR rates by viral genotype, stage of fibrosis, treatment regimen, and treatment history | No | 2 |
|
Cost Parameters |
|||
| Cost of DAA treatment | $20,000 | Yes | 23-26 |
| Cost of disease management (annual) | |||
| F0–F2 | $809 | No | 27,41,42 |
| F3 | $1,661 | No | 27,41,42 |
| Compensated cirrhosis | $12,065 | No | 27,41,42 |
| Decompensated cirrhosis | $21,553 | No | 27,41,42 |
| Hepatocellular carcinoma | $39,598 | No | 27,41,42 |
| Liver transplant (Year 1) | $114,505 | No | 27,41,42 |
| Liver transplant (Year 2+) | $32,010 | No | 27,41,42 |
| Cost of diagnosis (per case) | |||
| Diagnostic and risk-based testing | $357 | No | 43 *** |
| Birth-cohort screening | $2,500 | No | 21 |
| Universal screening | $4,400 | No | 21 |
*Based on unpublished recent CDC analysis that used multiple state- and national-level datasets.44-48 (Appendix Table A.2).
**Based on the assumption that universal screening rate is equal to the birth-cohort screening rate.
***Based on the assumption that HCV (viremic) prevalence in high-risk groups is 15.48%,43 cost of HCV RNA test is $98, cost of antibody test is $35, the cost of per HCV (viremic) case detected is $357.
Abbreviations: HCV, hepatitis C; F0, no fibrosis; F1, portal fibrosis without septa; F2, portal fibrosis with few septa; F3, numerous septa without cirrhosis; F4, cirrhosis; DC, decompensated cirrhosis; HCC, hepatocellular carcinoma; LT, liver transplantation (first year); PLT, post liver transplantation (> 1 year), DAA treatment, direct-acting antiviral treatment.
References:
- Chhatwal J, Chen Q, Aggarwal R. Estimation of Hepatitis C Disease Burden and Budget Impact of Treatment Using Health Economic Modeling. Infectious Disease Clinics. 2018;32(2):461-480.
- Chhatwal J, Chen Q, Ayer T, et al. Hepatitis C virus re-treatment in the era of direct-acting antivirals: projections in the USA. Alimentary pharmacology & therapeutics. 2018;47(7):1023-1031.
- Chhatwal J, Wang X, Ayer T, et al. Hepatitis C disease burden in the United States in the era of oral direct-acting antivirals. Hepatology (Baltimore, Md). 2016;64(5):1442-1450.
- van der Meer AJ, Veldt BJ, Feld JJ, et al. Association between sustained virological response and all-cause mortality among patients with chronic hepatitis C and advanced hepatic fibrosis. Jama. 2012;308(24):2584-2593.
- Denniston MM, Jiles RB, Drobeniuc J, et al. Chronic Hepatitis C Virus Infection in the United States, National Health and Nutrition Examination Survey 2003 to 2010. Annals of internal medicine. 2014;160(5):293-300.
- Lang K, Danchenko N, Gondek K, Shah S, Thompson D. The burden of illness associated with hepatocellular carcinoma in the United States. Journal of hepatology. 2009;50(1):89-99.
- Hofmeister MG, Rosenthal EM, Barker LK, et al. Estimating Prevalence of Hepatitis C Virus Infection in the United States, 2013-2016. Hepatology (Baltimore, Md). 2018.
- Islam N, Krajden M, Shoveller J, et al. Incidence, risk factors, and prevention of hepatitis C reinfection: a population-based cohort study. The lancet Gastroenterology & hepatology. 2017;2(3):200-210.
- Falade-Nwulia O, Sulkowski MS, Merkow A, Latkin C, Mehta SH. Understanding and addressing hepatitis C reinfection in the oral direct-acting antiviral era. J Viral Hepat. 2018;25(3):220-227.
- Rosenberg ES, Rosenthal EM, Hall EW, et al. Prevalence of Hepatitis C Virus Infection in US States and the District of Columbia, 2013 to 2016. JAMA Network Open. 2018;1(8):e186371-e186371.
- Hep Corrections. http://www.hepcorrections.org/ (last accessed: February 15, 2019).
- Thanthong-Knight, S. “State Prisons Fail To Offer Cure To 144,000 Inmates With Deadly Hepatitis C”. Kaiser Health News, July 9, 2018. Available at: https://tinyurl.com/yycxqwh9 (last accessed: February 15, 2019)
- Spaulding AC, Anderson EJ, Khan MA, Taborda-Vidarte CA, Phillips JA. HIV and HCV in U.S. Prisons and Jails: The Correctional Facility as a Bellwether Over Time for the Community's Infections. AIDS reviews. 2017;19(3).
- Varan AK, Mercer DW, Stein MS, Spaulding AC. Hepatitis C seroprevalence among prison inmates since 2001: still high but declining. Public health reports (Washington, DC : 1974). 2014;129(2):187-195.
- Pham TT, Keast SL, Farmer KC, et al. Sustained Virologic Response and Costs Associated with Direct-Acting Antivirals for Chronic Hepatitis C Infection in Oklahoma Medicaid. Journal of managed care & specialty pharmacy. 2018;24(7):664-676.
- Rice JB, Kirson NY, Shei A, et al. Estimating the costs of opioid abuse and dependence from an employer perspective: a retrospective analysis using administrative claims data. Applied health economics and health policy. 2014;12(4):435-446.
- MappingHepC. AbbVie Inc, Chicago, IL. www.mappinghepc.com (last accessed: February 15, 2019).
- Viral Hepatitis: Statistics and Surveillance. Centers for Disease Control and Prevention, Atlanta, GA.; 2018. https://www.cdc.gov/hepatitis/statistics/index.htm
- Denniston MM, Klevens RM, McQuillan GM, Jiles RB. Awareness of infection, knowledge of hepatitis C, and medical follow-up among individuals testing positive for hepatitis C: National Health and Nutrition Examination Survey 2001-2008. Hepatology (Baltimore, Md). 2012;55(6):1652-1661.
- Sullivan JM, Soh J, Khan MA, Thompson WW, Nelson N. Trend analysis in hepatitis C virus testing among individuals covered by commercial insurance plans or Medicare Advantage, OptumLabs Data Warehouse, 2011–2017. International Society for Disease Surveillance (ISDS) conference, San Diego, CA, January 2019. 2019.
- Barocas JA, Tasillo A, Eftekhari Yazdi G, et al. Population-level Outcomes and Cost-Effectiveness of Expanding the Recommendation for Age-based Hepatitis C Testing in the United States. Clinical infectious diseases : an official publication of the Infectious Diseases Society of America. 2018;67(4):549-556.
- AASLD-IDSA. Recommendations for testing, managing, and treating hepatitis C. http://www.hcvguidelines.org. (last accessed: April 20, 2018).
- A perspective from our CEO: Gilead Subsidiary to Launch Authorized Generics to Treat HCV “Gilead company statement. Available at: https://www.gilead.com/news-and-press/company-statements/authorized-generics-for-hcv; accessed February 14, 2019.
- GoodRx. “FDA Approves Mavyret for Hepatitis C”. Available at: https://www.goodrx.com/blog/fda-approves-mavyret-for-hepatitis-c/; accessed February 14, 2019
- The 340B Drug Discount Program. Health Affairs Health Policy Brief, September 14, 2017. DOI: 10.1377/hpb20171024.663441.
- Medicaid Best Price. Health Affairs Health Policy Brief, August 10, 2017. DOI: 10.1377/hpb20171008.000173.
- Chhatwal J, Kanwal F, Roberts MS, Dunn MA. Cost-effectiveness and budget impact of hepatitis C virus treatment with sofosbuvir and ledipasvir in the United States. Annals of internal medicine. 2015;162(6):397-406.
- Thein H, Yi Q, Dore G, Krahn M. Estimation of stage specific fibrosis progression rates in chronic hepatitis C virus infection: A meta analysis and meta regression. Hepatology (Baltimore, Md). 2008;48(2):418-431.
- Fattovich G, Giustina G, Degos F, et al. Morbidity and mortality in compensated cirrhosis type C: a retrospective follow-up study of 384 patients. Gastroenterology. 1997;112(2):463-472.
- Cardoso AC, Moucari R, Figueiredo-Mendes C, et al. Impact of peginterferon and ribavirin therapy on hepatocellular carcinoma: incidence and survival in hepatitis C patients with advanced fibrosis. Journal of hepatology. 2010;52(5):652-657.
- Planas R, Ballesté B, Antonio Álvarez M, et al. Natural history of decompensated hepatitis C virus-related cirrhosis. A study of 200 patients. Journal of hepatology. 2004;40(5):823-830.
- Thuluvath P, Guidinger M, Fung J, Johnson L, Rayhill S, Pelletier S. Liver transplantation in the United States, 1999–2008. American Journal of Transplantation. 2010;10(4p2):1003-1019.
- Davis G, Alter M, El-Serag H, Poynard T, Jennings L. Aging of hepatitis C virus (HCV)-infected persons in the United States: a multiple cohort model of HCV prevalence and disease progression. Gastroenterology. 2010;138(2):513-521.
- Saab S, Hunt DR, Stone MA, McClune A, Tong MJ. Timing of hepatitis C antiviral therapy in patients with advanced liver disease: A decision analysis model. Liver Transplantation. 2010;16(6):748-759.
- Wolfe R, Roys E, Merion R. Trends in Organ Donation and Transplantation in the United States, 1999–2008. American Journal of Transplantation. 2010;10(4p2):961-972.
- Soh JE, Khan MA, Thompson WW, Nelson N. Prevalence of self-reported hepatitis C virus testing among non-institutionalized individuals in the United States: National Health Interview Survey, 2013–2017. International Society for Disease Surveillance (ISDS) conference, San Diego, CA, January 2019. 2019.
- Isenhour C, Hariri S, Vellozzi C. Monitoring the hepatitis C care cascade using administrative claims data. The American journal of managed care. 2018;24(5):232-238.
- National Viral Hepatitis Roundtable and Harvard Law School’s Center for Health Law and Policy Innovation. Hepatitis C: State of Medicaid Access. Available at: https://stateofhepc.org/report/ ; accessed February 14, 2019.
- Jung JK, Feldman R, Cheong C, Du P, Leslie D. Coverage for hepatitis C drugs in Medicare Part D. The American journal of managed care. 2016;22(6 Spec No.):Sp220-226.
- Spaulding AC, Adee MG, Lawrence RT, Chhatwal J, von Oehsen W. Five Questions Concerning Managing Hepatitis C in the Justice System. Infectious Disease Clinics. 2018;32(2):323-345.
- Chhatwal J, Ferrante SA, Brass C, et al. Cost-Effectiveness of boceprevir in patients previously treated for chronic hepatitis C genotype 1 Infection in the United States. Value in Health. 2013;16(6):973-986.
- McAdam-Marx C, McGarry LJ, Hane CA, Biskupiak J, Deniz B, Brixner DI. All-cause and incremental per patient per year cost associated with chronic hepatitis C virus and associated liver complications in the United States: A managed care perspective. J Manag Care Pharm. 2011;17(7):531-546.
- He T, Li K, Roberts MS, et al. Prevention of Hepatitis C by Screening and Treatment in U.S. Prisons. Annals of internal medicine. 2016;164(2):84-92.
- Ambulatory Health Care Data. National Center for Health Statistics. Centers for Disease Control; and Prevention, Atlanta, GA.; 1973-2015. https://www.cdc.gov/nchs/ahcd/index.htm.
- HCUPnet. Healthcare Cost and Utilization Project (HCUP). Agency for Healthcare Research and Quality, Rockville, MD.; 1990-2015. https://hcupnet.ahrq.gov/#setup.
- HCUP National (Nationwide) Inpatient Sample (NIS). Healthcare Cost and Utilization Project (HCUP). Agency for Healthcare Research and Quality, Rockville, MD.; 1980-2015. https://www.hcup-us.ahrq.gov/nisoverview.jsp.
- HCUP State Emergency Department Databases (SEDD). Healthcare Cost and Utilization Project (HCUP). Agency for Healthcare Research and Quality, Rockville, MD.; 2001-2015. https://www.hcup-us.ahrq.gov/db/state/sedddbdocumentation.jsp.
- HCUP Nationwide Emergency Department Sample (NEDS). Healthcare Cost and Utilization Project (HCUP). Agency for Healthcare Research and Quality, Rockville, MD.; 2006-2015. https://www.hcup-us.ahrq.gov/db/nation/neds/nedsdde.jsp.
- Weiss AJ, Heslin KC. Payers of Opioid-Related Inpatient Stays and Emergency Department Visits Nationally and by State, 2010 and 2015. HCUP Statistical Brief #239. 2018;May.
- Grant WC, Jhaveri RR, McHutchison JG, Schulman KA, Kauf TL. Trends in health care resource use for hepatitis C virus infection in the United States. Hepatology. 2005;42(6):1406-1413.
- Ngo-Metzger Q, Mabry-Hernandez I, Heslin K, Weiss A, Mummert A, Bierman A. Characteristics of Inpatient Stays Involving Hepatitis C, 2005–2014: Statistical Brief# 232. 2017.
- Guy GP, Pasalic E, Zhang K. Emergency department visits involving opioid overdoses, US, 2010–2014. American journal of preventive medicine. 2018;54(1):e37-e39.
- HCUP Nationwide Emergency Department Database (NEDS) Restricted Access File. Healthcare Cost and Utilization Project (HCUP). Agency for Healthcare Research and Quality, Rockville, MD; 2017. https://healthdata.gov/dataset/hcup-nationwide-emergency-department-database-neds-restricted-access-file.
- HCUP State Inpatient Databases (SID). Healthcare Cost and Utilization Project (HCUP). Agency for Healthcare Research and Quality, Rockville, MD.; 1990-2015. https://www.hcup-us.ahrq.gov/db/state/siddbdocumentation.jsp.